 Newsletters
 Risk Central
 Digital Edition
Global Catastrophe Losses Set To Average $171 Billion A Year, Verisk Finds
The global modeled insured average annual property loss, or AAL, from natural catastrophes now stands at $171 billion, estimates Verisk in a new report, up from $59 billion when the company first published the figure in 2012 dollars.
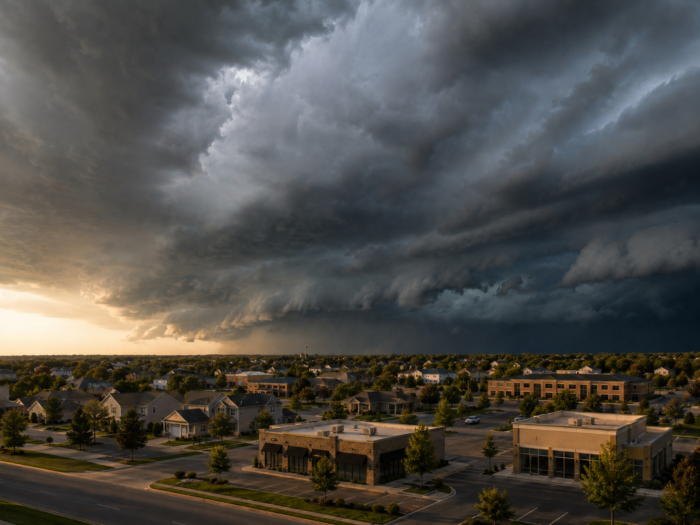
The increase reflects expanded model coverage across more than 20 new countries and regions, along with advances in science, data and modeling methods, Verisk said. The figure arrives as 2025 marked the sixth consecutive year that global insured catastrophe losses exceeded $100 billion, a total driven largely by the costliest wildfires ever recorded and severe thunderstorm activity averaging $771 million per event, even though no hurricane made landfall in the continental U.S. for the first time in a decade, the report said.
“A quiet hurricane season can lead markets to respond as if risk has eased: rates soften, insurers keep more risk on their own books, and more capital competes to write new business,” said Rob Newbold, president of Verisk Catastrophe and Risk Solutions. “But 2025 reminds us that the underlying risk landscape has changed and years without significant losses from U.S. hurricane activity no longer signal a quieter catastrophe environment.”
A Widening Global Protection Gap
Verisk’s aggregate AAL exceedance probability curve shows insured losses reaching $309 billion at a 5% annual probability (a 20-year return period), $477 billion at 1% (a 100-year return period) and $606 billion at 0.4% (a 250-year return period), up from $176 billion, $285 billion and $359 billion, respectively, in 2021.
North America accounts for $124 billion of the $171 billion global AAL, followed by Europe at $24 billion, Asia at $10 billion, Latin America at $7 billion and Oceania at $5 billion, the report said.
Globally, insured losses represent more than 38% of total economic losses when adjusted for inflation, implying an economic AAL of more than $450 billion, according to Verisk. That protection gap varies sharply by region: North America’s insured share of economic losses is about 53%, compared with 46% in Oceania, 33% in Latin America, 22% in Europe and about 14% in Asia. The report cited examples from 2025, including a March earthquake in Myanmar that caused approximately $12 billion in economic loss but less than $100 million in insured losses, a gap exceeding 99%, compared with Windstorm Éowyn in Ireland, where the gap was 14% to 26%.
Even in mature markets, gaps persist: the July 2025 Central Texas floods, the deadliest flash flood event in nearly five decades, hit an area with a flood insurance take-up rate of just 2.5% in Kerr County, leaving most of the $1.1 billion in residential economic losses to fall on families and communities already bearing the human toll, the report said.
Tropical Cyclone Alfred in Australia revealed a roughly 25% protection gap, which the report attributed to state insurance taxes and levies and elevated rebuilding costs that suppress take-up despite a federal cyclone reinsurance pool.
Four Forces Driving Losses Higher
Verisk attributed the rising loss figures to four factors embedded in its models. The first is a “near-present climate” view that accounts for warming seas and large-scale climate variability, including the El Niño Southern Oscillation, which the report said raises expected hazard levels above historical records, particularly in the tail of the loss distribution.
The second is demand surge, the temporary spike in materials, labor and services costs following a catastrophe, which Verisk said contributes 10%, or $15.7 billion, to the global modeled AAL and can increase U.S. tropical cyclone losses by 13% at the AAL level and by 23% at a 100-year return period. The report also noted that construction labor shortages and reconstruction delays have historically increased losses by 20% to 30% or more after large catastrophes.
The third factor is increasingly precise, site-specific vulnerability modeling that incorporates construction type, year built, occupancy and roof characteristics rather than regional averages, which the report said sharpens risk selection at the property and portfolio level. The fourth is exposure growth: global property exposure in Verisk-modeled countries grew about 7% annually from 2021 through 2025, ranging from 6.3% in Asia to 8.6% in Oceania, driven by a combination of new construction and price inflation, according to the report.
In the U.S., residential reconstruction costs rose 5.0% annually over that period, compared with 4.4% for overall consumer prices, and the report noted that even a 3.3% annual increase in exposure value from construction cost inflation alone would compound to nearly a 38% rise in losses over 10 years.
Verisk’s current model suite, covering perils in more than 120 countries and regions, captured 94% of worldwide insured losses on average from 2016 through 2025, a figure that rises to 97% when including third-party models available through Verisk Model Exchange, the report said.
The report also pointed to progress on California’s wildfire protection gap, noting that roughly 65% to 70% of the $53 billion to $65 billion in economic loss from the January 2025 Eaton and Palisades fires was insured, and that catastrophe modeling is now being incorporated into California ratemaking.
Obtain the full report here. &