Alternative Risk Strategies
Capital Flows Into CAT Bonds

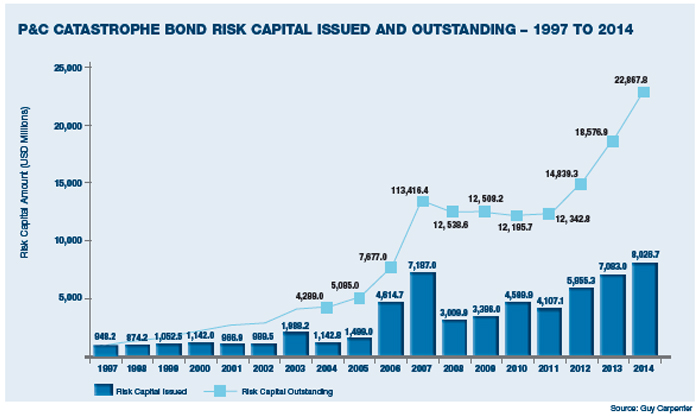
AACapital is increasingly flowing into property catastrophe bonds, with an industry record — $8 billion — being issued just in the fourth quarter of 2014.
Overall, total risk capital outstanding as of year end, was $22.868 billion, the highest level of outstanding risk capital the market has ever supported, according to a report by Guy Carpenter.
In addition, the reinsurance broker noted that “persistent year-on-year growth issuance” indicates that the market is maturing and stabilizing.
“The continued influx of third-party capital from new and existing market participants also favorably impacted ILS [insurance-linked securities] pricing for protection buyers,” according to a year-end report by Guy Carpenter.
“The continued low interest rate environment encouraged institutional investors (such as pension funds and hedge funds) to seek the higher yields offered by natural CAT notes.”
CAT bonds are also increasingly being used by insurers of the last resort to transfer some of their peak exposures to the capital markets, according to a rating agency A.M. Best.
Insurers of the last resort are those that include Fair Access to Insurance Requirements (FAIR) plans, quasi-state-run insurance companies and beach/windstorm plans.
According to a report by A.M. Best, these entities have welcomed the growing availability of insurance-linked instruments such as CAT bonds, insurance-linked funds and industry loss warranties (ILWs).
“Given an increase in exposure to loss for insurers of the last resort, CAT bonds have provided another alternative for these entities to cede part of their peak exposures as a complement to the traditional reinsurance market,” said Asha Attoh-Okine, managing senior financial analyst of insurance-linked securities at A.M. Best and author of the report.
“Catastrophe bonds also provide multiyear coverage as opposed to most traditional reinsurance programs,” he said.
Approximately $5.6 billion in CAT bonds were issued by seven of these entities from 2009 through Sept. 30, 2014, according to the A.M. Best report.
The two main perils covered were hurricanes and earthquakes occurring in the respective regions that the bonds were placed.
Hurricanes accounted for approximately $4.53 billion, or 81 percent, with earthquakes taking the other $1.05 billion, or 19 percent, for these entities during the period reviewed by the ratings agency.
“The increased use of these insurance-linked instruments is due to growth in investor demand,” said Attoh-Okine.
Below Average Activity
As insurers and investors consider CAT bonds, however, it may be important to note that 2014 was a relatively quiet year for natural catastrophes, according to Munich Re. This year may not be.
“Though tragic in each individual case, the fact that fewer people were killed in natural catastrophes last year is good news,” said Torsten Jeworrek, a Munich Re board member.
“And this development is not a mere coincidence. In many places, early warning systems functioned better, and the authorities consistently brought people to safety in the face of approaching weather catastrophes, for example before Cyclone Hudhud struck India’s east coast and Typhoon Hagupit hit the coast of the Philippines.
“However, the lower losses in 2014 should not give us a false sense of security, because the risk situation overall has not changed. There is no reason to expect a similarly moderate course in 2015. It is, however, impossible to predict what will happen in any individual year.”
Nonetheless, usage has expanded a great deal in recent years.
Guy Carpenter cited deals that include Turkey’s Turkish Catastrophe Insurance Pool, Mexico’s FONDEN and New Zealand’s EQC.
“Most large U.S. insurers of last resort, such as CEA, Citizens, North Carolina Joint Underwriting Association and the North Carolina Insurance Underwriting Association (NCJUA/NCIUA), and Texas Windstorm Insurance Association, are utilizing capital markets capacity including collateralized reinsurance and catastrophe bonds,” it said.
A.M. Best’s Attoh-Okine noted that investors are “attracted to these products given the low-interest environment for fixed income securities of similar quality and the perceived minimal correlation to the general financial market.
“Sponsors have also continued to increase the use of CAT bonds and other insurance-linked instruments to cede their peak exposures.
“Lately,” he said, “we have seen a decrease in spread [price] for the same level of risk for CAT bonds, providing sponsors cost relief when compared to the traditional property catastrophe reinsurance market.”
“Catastrophe bonds also provide multiyear coverage as opposed to most traditional reinsurance programs.” — Asha Attoh-Okine, managing senior financial analyst, A.M. Best
His report noted that other areas that might benefit from the use of alternative risk transfer instruments include terrorism risk exposure; assigned risk non-property plans facing inadequate pricing/capacity issues (e.g., workers’ compensation, auto, accident/health), and the National Flood Insurance Program, which provides flood insurance to approximately 5.5 million U.S. properties with total insured values exceeding $1 trillion, and growing.
While alternative products reduce credit risk for the insurer, the main drawback for CAT bonds and ILWs “is the lack of reinstate features when compared to the traditional reinsurance program,” he said.
Reinstate implies the restoration of the reinsurance limit of an excess property treaty to its full amount after payment by the reinsurer of a loss as a result of an occurrence.
“Another criticism for the use of these instruments,” he said, “is whether investors’ participation will continue in case of property catastrophe insurance market disruption as result of a huge catastrophe event or if we start seeing a continuous increase in returns for other fixed income instruments.”
According to Attoh-Okine, if a major hurricane or other natural disaster triggers one of the CAT bonds, the sponsor of the bond will be reimbursed for the loss amount up to the amount of the CAT bond.
In such a case, investors will lose part or all of the principal amount and the corresponding interest proceeds.
Guy Carpenter said the capital markets-based capacity allows entities to utilize cost savings to build surplus or buy needed additional coverage.
Such vehicles also improve coverage terms (transforming programs from per occurrence to annual aggregate responses) and provide leverage “to keep traditional capacity sources honest and to facilitate their willingness to adjust coverage terms that may not have been feasible without the use of capital markets-based risk transfer capacity,” it said.
“At the time of loss, governments may be spared these enormous costs and they may have enhanced flexibility to finance economic and social development or reduce taxation.
“Because entities such as windpools tend to be limited in geographic scope and/or peril, with more of an affinity for single limit/aggregate coverage, they present an attractive profile to collateralized reinsurers and catastrophe bond investors.
“Competition and excess capacity for this business has significantly reduced price and in just the past year, the growth in both limit purchased by these entities and share of overall limit placed into the collateralized market has been significant.
“As an example, profiling limits purchased by U.S. windpools in 2014 compared to 2013, catastrophe bond limits increased by almost 50 percent while rated and collateralized reinsurance limit purchased grew by approximately 30 percent, leading to a total growth in coverage of roughly 35 percent. In addition, the collateralized market share of the limit purchased has outpaced the growth in rated carriers’ increased participations … .”
$110 Billion in Losses
According to Munich Re, overall losses from natural catastrophes totalled $110 billion in 2014, down from the previous year’s total of $140 billion, of which roughly $31 billion (previous year $39 billion) was insured.
The loss amounts were well below the inflation-adjusted average values of the past 10 years (overall losses, $190 billion, insured losses, $58 billion), and also below the average values of the past 30 years ($130 billion overall / $33 billion insured).
At 7,700, the number of fatalities was much lower than in 2013 (21,000) and also well below the average figures of the past 10 and 30 years (97,000 and 56,000, respectively). The figure was roughly on a par with that of 1984.
The most severe natural catastrophe in these terms was the flooding in India and Pakistan in September, which caused 665 deaths.
In total, 980 loss-related natural catastrophes were registered, a much higher number than the average of the last 10 and 30 years (830 and 640). Broader documentation is likely to play an important role in this context, since, particularly in years with low losses, small events receive greater attention than was usual in the past.
The costliest natural catastrophe of the year was Cyclone Hudhud, with an overall loss of $7 billion.
The costliest natural catastrophe for the insurance industry was a winter storm with heavy snowfall in Japan, which caused insured losses of $3.1 billion.
More than nine of 10 (92 percent) of the loss-related natural catastrophes were due to weather events.
A striking feature was the unusually quiet hurricane season in the North Atlantic, where only eight strong — and thus named — storms formed; the long-term average, calculated from 1950 to 2013, is around 11.
In contrast, the tropical cyclone season in the eastern Pacific was characterized by an exceptionally large number of storms, most of which did not make landfall.
One storm in the eastern Pacific, Hurricane Odile, moved across the Baja California peninsula in a northerly direction and caused a loss of $2.5 billion (of which $1.2 billion was insured) in Mexico and southern states in the U.S.
In the Northwestern Pacific, a relatively large number of typhoons hit the Japanese coast, but losses there remained small thanks to the high building and infrastructure standards in place.
“The patterns observed are well in line with what can be expected in an emerging El Niño phase,” said Peter Höppe, head of geo risks research at Munich Re. “This characteristic of the ENSO (El Niño Southern Oscillation) phenomenon in the Pacific influences weather extremes throughout the world.”
Water temperatures in the North Atlantic were below average and atmospheric conditions such as lower humidity and stronger wind shear also inhibited the development of tropical cyclones. Even events like the severe windstorms and heavy rainfall in California in December following a long drought fit in with the El Niño pattern.
Höppe added that most scientists expect a light to moderate El Niño phase to persist until mid-2015.
“Following the below-average incidence in 2014, this could increase the frequency of tornadoes in the USA. If the El Niño phase does, in fact, end towards the middle of the year, there would be no cushioning effects from the ENSO oscillation in the main phase of the tropical storm season.”
The reinsurer added one last point — that the greatest losses in North America over the past year stemmed from cold temperatures. Heavy frost in many parts of the USA and Canada, along with blizzards, particularly on the East Coast, caused losses of $3.7 billion in 2014 alone, of which $2.3 billion was insured.
Munich Re’s point is a rather sobering one — what if 2015 is a very different year than 2014 in terms of catastrophes?
The catastrophe bond market will soon find out.


