Auto Lines in 2022 and Beyond: An Actuary’s Detailed Guide to Where Things Stand Today and Why
As the U.S. personal automobile insurance market combined ratio ends 2021 over 100% for the first time since 2017, many companies reported significantly worse combined ratios in the fourth quarter of 2021 and Q1 2022 compared to prior periods (e.g., Kemper’s Specialty Property & Casualty Insurance reported a 119% combined ratio in Q4 2021 and 109% in Q1 2022).
Additionally, the prior period reserves of many companies are displaying adverse trends, and their current periods are experiencing tumultuous spikes in severity. Therefore, U.S. personal auto insurance companies will face significant challenges for the rest of 2022 and 2023.
GEICO companies experienced collision severity trends greater than 15% for all of 2021, which was a deterioration from the already high 13+% collision severity trends they reported in the first nine months of 2021. GEICO attributed these high trends to a myriad of factors leading to increased claim severity, including “increasing repair costs, supply chain disruptions, the semiconductor chip shortage, rising medical costs, and general inflation.” Allstate’s fourth-quarter press release also points to auto claim severity as a cause of loss ratio increases.
Allstate cites the main contributors to increased auto claim severity to be increased used car prices, higher parts and labor costs, medical inflation, and greater attorney representation. Kemper and Progressive also mention an increase in auto claim severity as a driving force in their fourth-quarter results. These factors appear to be affecting trends throughout the entire industry with no end in sight.
Inflation and War Create Upward Cost Pressure
We are all feeling the effects of inflation at the pump and in the grocery store, so it seems only natural that insurers are feeling its effects through an increase in claim severity. A look at the table in Figure 1 shows that the consumer price index (CPI) for all items has increased 11.2% since the beginning of 2020. By comparison, the price of motor vehicle parts and equipment has increased by nearly 15% during the same time period.
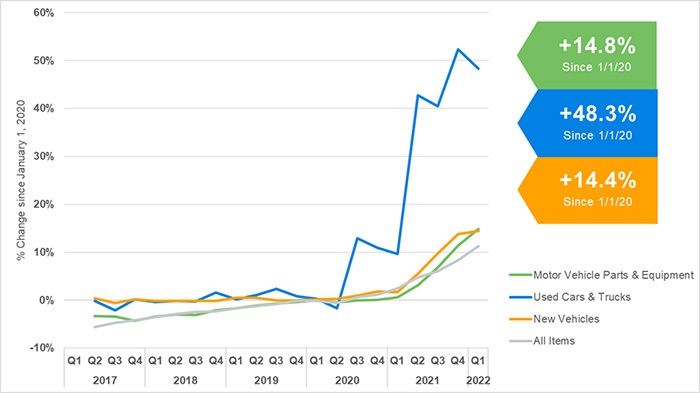
Fig. 1
This increase in the cost of parts and equipment is contributing to higher auto insurance loss costs when vehicle repairs are necessary. However, the increased costs of parts and equipment are not the only items causing upward pressure on the severity of repair claims.
The table in Figure 2 shows that the average wages for automotive technicians and repairers rose a cumulative 12.3% from 2017 to 2021, whereas the previous four-year period from 2013 to 2017 saw less than an 8.0% increase.
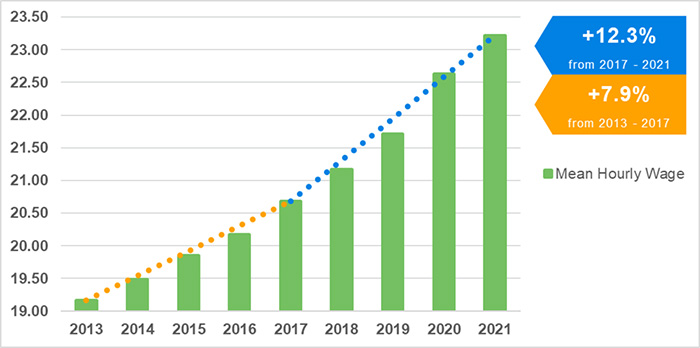
Fig. 2
In addition to typical inflation, insurers are also feeling the pressure of social inflation. Social inflation is the tendency toward higher insurance claim costs as a result of a shift in societal views of litigation.
Not only is the industry experiencing social inflation, but companies such as Allstate cite greater attorney representation in general as a contributor to 2021’s high auto severities. Typically, attorney involvement significantly increases the costs of insurance claims. Increased severity is not only manifesting itself in the higher cost of parts, labor, and jury verdicts, but also in large increases in vehicle prices.
The rise in the cost of general goods has been outpaced by the rise in the cost of both new and used vehicles. As can be seen in Figure 1, the average cost of a new vehicle has increased by 14.4% since the beginning of 2020, and the average cost of a used vehicle has increased by a staggering 48.3% since 2020.
Pre-pandemic, only 0.3% of new vehicles sold for more than the manufacturer suggested retail price (MSRP). A year later, in January 2021, the percentage of car-buyers paying over MSRP had risen to 2.8%. Yet this leap was nothing in comparison to the reports that, during January 2022, 82.2% of all new vehicle purchases exceeded the MSRP.
A whole myriad of supply chain issues, including suppliers’ pandemic-related plant shutdowns, shortages of ships and shipping containers, scarcity of truck drivers, a desire for more workers in many roles, and, of course, the chip shortage, has led to the supply of new vehicles greatly underperforming the demand for new vehicles.

Brian Brown, principal and consulting actuary, Milliman, Inc.
In addition, indirect insurance-related costs are impacted by the supply chain issues through such matters as an increased use of rental car coverage due to the fact that damaged vehicles are taking longer to repair. These trends result in higher costs for total losses.
Unfortunately, the Russian invasion of Ukraine is making neon and palladium, two components used in the production of semiconductors, more difficult to acquire and may also exacerbate chip shortages. According to S&P Capital IQ, “Ukraine is a key supplier of neon, while Russia mines much of the world’s palladium,” and the auto industry is likely to feel the additional impact of neon and palladium shortages in the second and third quarters of 2022 as global inventories are depleted.
The same supply chain issues affecting the average person’s ability to purchase a vehicle are also impacting the car rental industry.
The number of new vehicles added to the U.S. car rental fleet in 2021, at just 725,000, was less than half of the number of new vehicles added to the U.S. car rental fleet in 2019, 1,739,000. Consequently, the cost of renting a vehicle, which contributes to auto severity, has nearly doubled from $46/day to $81/day between December 2019 and December 2021.
Although the recent impact of supply chain issues and inflation has been significant, they are not the only factors pushing auto severities upward. In addition to these direct influences on the cost of auto insurance claims, a greater number of distractions for those behind the wheel may also be a factor in increased auto severities.
Technological Innovations Cut Both Ways
As the amount of technology at our fingertips increases, the potential for distractions impacting those behind the wheel follows a similar trajectory. Not surprisingly, the percentage of the population owning a smartphone has dramatically increased from 35% in 2012 to 85% in 2021.
About 60% of states are attempting to combat distracted driving through the banning of handheld phone calls. Every state except for Montana and Missouri has banned all texting while driving, and Missouri does have a texting ban for younger drivers. Despite these laws, many people admit to continuing to text while they drive putting upward pressure on auto claim frequency trends.
By the end of 2021, most of the major auto insurers reported a return to pre-pandemic or near pre-pandemic claim frequency levels as many people returned to work and travel patterns were reminiscent of pre-pandemic activity levels. Despite the recent rise in both severity and frequency rates, there are several bright spots on the horizon for auto insurers such as advanced driver-assistance systems (ADAS) and smartphone safer driving applications.
ADAS are becoming more prevalent in vehicles on the road today, and they will likely play a large role in the future in both frequency and severity rates. The most common types of ADAS are front crash prevention, lane departure warning, lane departure prevention, blind spot detection, and rear crash prevention. The Highway Loss Data Institute (HLDI) recently released a study examining the effects of these systems on claim severity, claim frequency, and overall loss levels.
In a front-crash prevention system, a vehicle is equipped with sensors that determine when the vehicle is getting too close to the vehicle in front of it. These systems typically warn the driver in some way such as a flashing light or beeping noise.
As seen in the table in Figure 3, a recent HLDI study found forward collision warning systems reduce frequency by 9.0% for property damage liability claims, 3.1% for collision claims, 17.4% for bodily injury claims, 19.6% for medical payment claims, and 10.0% for personal injury projection claims. However, these frequency reductions resulting from forward collision warning systems were partially offset by a slight increase in collision severity, probably due to the high cost of the technology required to support these systems.

Fig. 3
In a similar manner, HLDI’s study did not find a statistically significant difference in collision severity when forward crash prevention systems are equipped with front automatic emergency braking. However, HLDI did find a 3.0% reduction in collision frequency and a 2.9% decrease in overall losses under collision coverage.
In addition to this impact on collision coverage, vehicles possessing front automatic emergency braking technology are associated with significant reductions in the claim frequencies for other auto insurance coverages, including a 14.4% reduction in property damage liability claim frequency, a 24.4% reduction in bodily injury liability claim frequency, a 5.7% reduction in medical payment claim frequency, and a 3.3% reduction in personal injury protection claim frequency.
Forward crash avoidance systems are not the only types of ADAS impacting the severity and frequency of claims.
In addition to ADAS technology designed to prevent front-end crashes, there are also several different systems designed to help drivers stay in their lanes and/or change lanes safely. Lane departure warning systems are designed to prevent vehicles from unintentionally changing lanes, and, in some cases, they apply brakes or steering when a driver begins to change lanes without its turn signal activated. These systems did not show a conclusive reduction in claim frequency in the HLDI study.
However, as can be seen in the table in Figure 4, blind spot warning systems reduced frequency across all coverages studied. While blind spot monitoring helps drivers see what could be very dangerous to overlook, several other ADAS help drivers see their surroundings while parking or backing up.
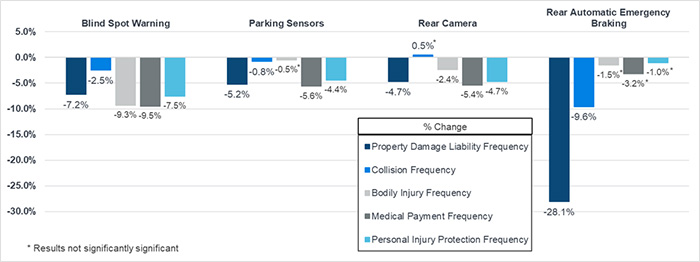
Fig. 4
Parking sensors, rear cameras, and rear automatic emergency braking will likely all influence the future of auto claim frequency and severity. As can be seen in Figure 4, parking sensors and rear cameras are generally contributing to the largest decrease in claim frequency for property damage liability and medical payment coverage.
According to the HLDI study, rear automatic emergency braking reduces the frequency of property damage liability claims by over 28% and the frequency of collision claims by nearly 10%. This reduction in frequency may correspond to an interesting and opposite effect on severity. Many of the accidents prevented by these rear sensors are low-speed, low-severity accidents. As more vehicles become equipped with these systems, many of these low-severity claims will no longer occur.
By the nature of low-severity claims disappearing, the overall average claim severity will likely shift upwards as the claims remaining will be the higher-severity claims. An additional potential contributor to increased severities due to these systems stems from the fact that the sensors and other safety equipment are often mounted to vehicles in locations more vulnerable to damage during a collision.
Therefore, despite being associated with decreased frequencies, some ADAS are also associated with increased severities. If the decrease in frequency is not greater than the increase in severity, an ADAS can actually increase the overall claim cost, as is the case of initial collision coverage results corresponding to curve-adaptive headlights (see table in Figure 3).

Katie Pipkorn, consulting actuary, Milliman, Inc.
ADAS are not the only emerging technological solution to reduce claim costs. Many smartphone applications are attempting to help drivers curb distracted driving tendencies.
Some smartphone operating systems are equipped with a driving mode, such as Apple’s iOS 11, which blocks notifications of incoming calls and texts when the smartphone is connected to the vehicle via Bluetooth or perceives driving motion. This system can be set up to automatically reply to the incoming message.
Other options include applications from mobile providers such as Sprint’s Drive First, which automatically silences email and text alerts and forwards calls to voicemail when it senses a vehicle is traveling at speeds greater than 10 mph. Other applications or built-in infotainment systems of vehicles read texts aloud to drivers.
Additional applications have been developed that send alerts to parents when a smartphone is being used while a vehicle is in motion with young drivers.
In addition to using new technology to help control their auto claim costs, insurers are also turning to more sophisticated analytical tools to evaluate and mitigate claim costs.
Opportunities in Risk Segmentation
Today many auto insurers are using their proprietary data to better segment their risks through generalized linear models (GLMs) or other machine learning techniques. One of the advantages of the GLM approach is the model’s ability to evaluate all of the proposed rating variables in tandem. This allows the insurer to account for any correlation between rating variables appropriately.
The commonly used example demonstrating the need to account for correlation comes when an auto insurance rating plan includes both age of driver and model year of vehicle. When we look at these two variables individually, we might notice that young drivers tend to have the worst loss experience, and older model year vehicles tend to also show poor experience.
Given this view of the data, we might decide to charge higher rates for both young drivers and older vehicles. However, what our analysis of individual variables fails to show us is that many younger drivers tend to drive older model year vehicles. Therefore, the poor results for older vehicles are more likely attributable to who is driving the vehicles, not the vehicles themselves.
If insurance companies surcharge both young drivers and older vehicles, they will in effect be double counting the adverse loss experience associated with young drivers. Using a tool such as a GLM that can simultaneously account for the effects of multiple variables helps insurers to handle the issue of correlated variables. Many insurers are already using GLMs or other machine learning analytical tools to help design the most efficient rating plans.
Along with leveraging their data to better understand the risks posed by their insureds, insurers are also able to use their data to better control their litigation costs. With increasing attorney presence in claims, insurers are having to combat that severity risk by retaining defense counsel more frequently. In doing so, it is critical that insurers select and retain counsel that get the best results in the most efficient manner.
Just like with risk segmentation discussed above, in order to select defense counsel effectively, insurers need to evaluate their counsel after adjusting or controlling for the types of claims being handled by their various defense firms. With the advent of data-mining techniques applied to the detailed attorney invoices, this is now possible.
In addition to using the data insurers already have at their fingertips to better segment their risk and analyze their defense spending, many insurers have started collecting new data elements corresponding to the driving behavior of their customers to further refine rating structures.
Insurers typically rely on a device inside the vehicle to collect information about the vehicle’s location, speed, idling time, harsh braking, and rapid acceleration. These devices, known as telematics devices, also monitor characteristics like what time of day a vehicle is being driven.
Some of these devices are installed directly inside vehicles, others are self-powered Bluetooth-enabled devices, and still others are applications on smartphones. Many of these devices are also able to track how much time drivers spend interacting with their smartphones.
Currently, most telematics programs are offered on a voluntary basis, where insurance customers can opt into a program in exchange for the potential to earn a premium discount based on driving behavior. Many of these programs also provide feedback and suggestions to drivers on how they can be safer drivers, thereby earning larger insurance discounts.
Commercial Auto Trends
The commercial auto market has been problematic for several years and insurers are struggling to be profitable. Carriers have significantly increased premium over the past couple of years. However, massive jury verdicts and settlements are becoming more common, and several carriers are struggling with prior year reserve development.
The outstanding question is whether the rate changes to date have been sufficient to address the loss trends, or if further action is needed to help this segment become profitable.
The data in Figures 5 through 7 was aggregated using S&P Global Market Intelligence software from December 31, 2021, statutory financial results reported through mid-June 2022. The table in Figure 5 displays calendar year loss and DCCE (CYLR) ratios for the 40 largest commercial auto liability writers.
As the table displays, the commercial auto liability CYLR ratio is higher than the CYLR for all lines of business for every year between 2017-21 with 2019 being 16 points worse. In 2021, the gap between the CYLR for commercial auto liability and the CYLR narrowed to less than 6 points higher than the CYLR for all lines of business, primarily due to the significant rate increases for commercial auto.
The CYLRs for certain states are even more problematic, for example, the 5-year CYLRs in Florida and Texas were over 90%.

Fig. 5

Fig. 6
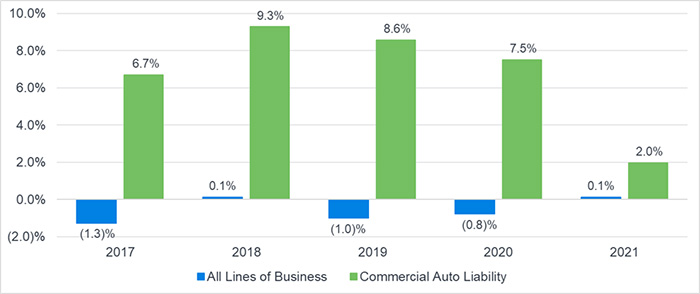
Fig. 7
To address the poor loss ratio results, carriers have increased premium significantly. The table in Figure 6 shows that direct written premium for the 40 largest commercial auto liability writers experienced double-digit increases in 3 of the last 4 years.
The year 2020 did not show double-digit increases in commercial auto liability written premium, however, we believe the smaller increase in 2020 was mostly due to COVID-19 where many insureds drove less, and many companies issued significant premium refunds and rebates. The 2021 direct written premium growth rebounded to 21.3%. AM Best estimated commercial auto rate increases near or above 10% during 2021.
However, prior year reserve increases have haunted commercial auto writers. The table in Figure 7 shows one-year reserve development relative to net earned premium for commercial auto liability compared to all lines of business for the 40 largest commercial auto liability writers.
The commercial auto liability segment experienced one-year adverse reserve development between 6.7% and 9.3% from 2017-2020, while the one-year reserve development for all lines of business was either flat or slightly favorable for the same period. The 2021 one-year reserve development for the commercial auto liability segment fell to 2.0%; however, in 2021 the accident year loss ratios deteriorated for 2017, 2018, and 2019.
The question is, did the pandemic have a favorable impact on reserve development, and did carriers finally address the reserving issues, or will prior accident year results continue to deteriorate in future years.
The loss trends mentioned previously for personal auto (e.g. CPI trends, cost of material, supply chain issues, etc.) also apply to commercial auto. In addition, social inflation and the explosion in jury awards in commercial auto is creating turmoil in the market. Stephanie Fox of Verisk said the average verdict for verdicts more than $1 million increased ten-fold from 2010 to 2018.
Another factor driving loss trends is the shortage of truck drivers and the fact that new drivers have less experience. Somewhat offsetting the above factors are the same factors that we discussed for personal auto (e.g. refined rating plans, telematics, better managing legal costs, and vehicles improvements to reduce accidents). We believe that insurance carriers will need to continue to take aggressive actions to make commercial auto profitable in 2023 and beyond.
The rising frequency and severity rates for auto claims during 2021 and into 2022 have prompted many insurance companies and analytics teams to search for ways to control costs and adjust pricing in 2022. With the increasing number of ADAS-enabled vehicles on the roadways, the attempt to protect drivers from their own distracted habits, the further refinement of rating structures, and the filing of revised rates, the auto insurance industry might see the needle on frequency, severity, and profits move in 2023. &