Aon Released Their Quarterly D&O Pricing Index and It Reveals Difficult Road Ahead for Event-Driven Markets

Aon released its first quarter 2020 public D&O pricing report on May 13.
The report, which has been released every quarter since 2006, is compiled of averages regarding every policy that was placed for publicly traded companies during the quarter.
Given today’s economic environment as impacted by COVID-19, the results were not unexpected and show signs of an officially hard market.
By the numbers:
- Price per million increased 104.1% compared to the first quarter of 2019.
- For renewals with the same limit and deductible, prices increased by an average of 26.2%.
- 89.9% of primary policies renewed with the same limit;
- 56.6% renewed with the same deductible;
- 52.2% renewed with the same deductible and limit; and
- 94.2% renewed with the same carriers.
Though the recent price increase is sharp, average quarterly premiums were on a steady—yet rather rapid—rise in 2019 as well, with a 4.8% average price increase in the first quarter and a a 14.7% increase in the last quarter.
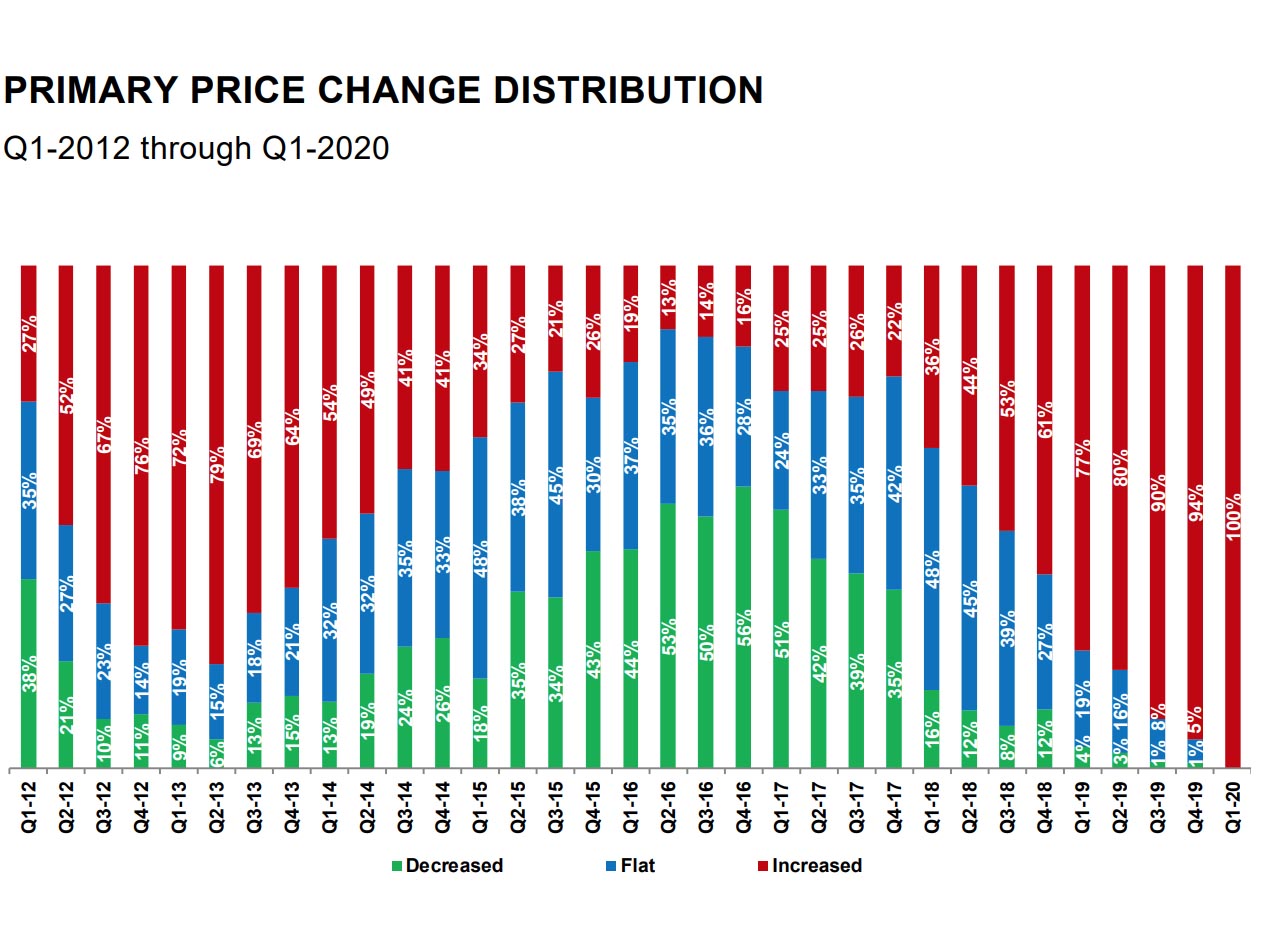
© Aon plc 2020. All rights reserved. Image courtesy of the Aon Quarterly D&O Pricing Index, compiled of policy data of the Aon Global Risk Insight Platform (“Aon GRIP”).
This quarter, the price index increased to 1.51 from 0.74 in the first quarter of 2019.

Peter M. Trunfio, chief data & analytics officer, Aon’s U.S. Financial Services Group
“In 2012, we started to drill down a little bit more, and ask, ‘What’s going on in the primary layer?’ ” said Peter M. Trunfio, chief data & analytics officer of Aon’s U.S. Financial Services Group and co-author of the report.
“To determine the price index, we take every single public D&O policy we placed during the quarter and we take the total premium for all of those policies and we divide it by the total limits for all of those policies, and then we divide that by one million,” he explained.
“So we’re getting an average rate per million. And then we divide that by the average rate per million for the base year, which was all of 2001.”
Modeling the Report
The price index is styled after a well-known financial index—the consumer price index (CPI). The CPI is modeled each month after the prices of everyday goods. However, when dealing with insurance policies, the numbers that make up the index are more complicated than what consumers can buy off of a shelf.
“In our business, our policies are written on an annual basis, so the basket of goods in each quarter is different,”said Trunfio.

© Aon plc 2020. All rights reserved. Image courtesy of the Aon Quarterly D&O Pricing Index, compiled of policy data of the Aon Global Risk Insight Platform (“Aon GRIP”).
“Quarter one is our seasonably smallest quarter, and quarter four is our largest. Quarters one and four are completely different baskets of goods, so it’s important to compare quarter one of the current year to quarter one of the prior year. We don’t have the same basket of goods from one quarter to the next.”
COVID-19 and the Report
When reviewing the report, it’s important to consider the market factors influencing the price increases, such as the economic slowdown that has resulted from COVID-19.
“The continuation of the bigger macroeconomic picture being problematic is when you see a lot of notices and claims. Certainly, we are anticipating some event driven claims; there’s been a handful so far,” said Christine Williams, chief executive officer of Aon’s Financial Services Group and co-author of the report.
“D&O insurers are concerned with paying claims that are driven from various events that they couldn’t have expected in their underwriting thrust, whether it be a cyber breach, a D&O mismanagement claim, claims emulated from EPL, wildfires, plane crashes,” she added.
“These are all event driven. We put COVID-19 in that same bucket.”
Prior to COVID-19, the U.S. economy was experiencing healthy growth, recovering from the 2008 financial crisis, but as previously stated, the report shows a steady rate of premium increases over the last three years. This is partially due to a rise in class action lawsuits, which have also led to a decrease in D&O capacity.
The Index cites a report from Cornerstone Research, stating that filing activity hit a peak in 2019: “Each of the last three years — 2017 through 2019 — has been more active than any previous year. More filings in federal and state courts occurred in 2019 than in any other year. Unlike in earlier years with heightened levels of filings (e.g. at the time of the dot-com bust or the financial crisis), the current peaks have occurred despite a lack of financial market turbulence.”
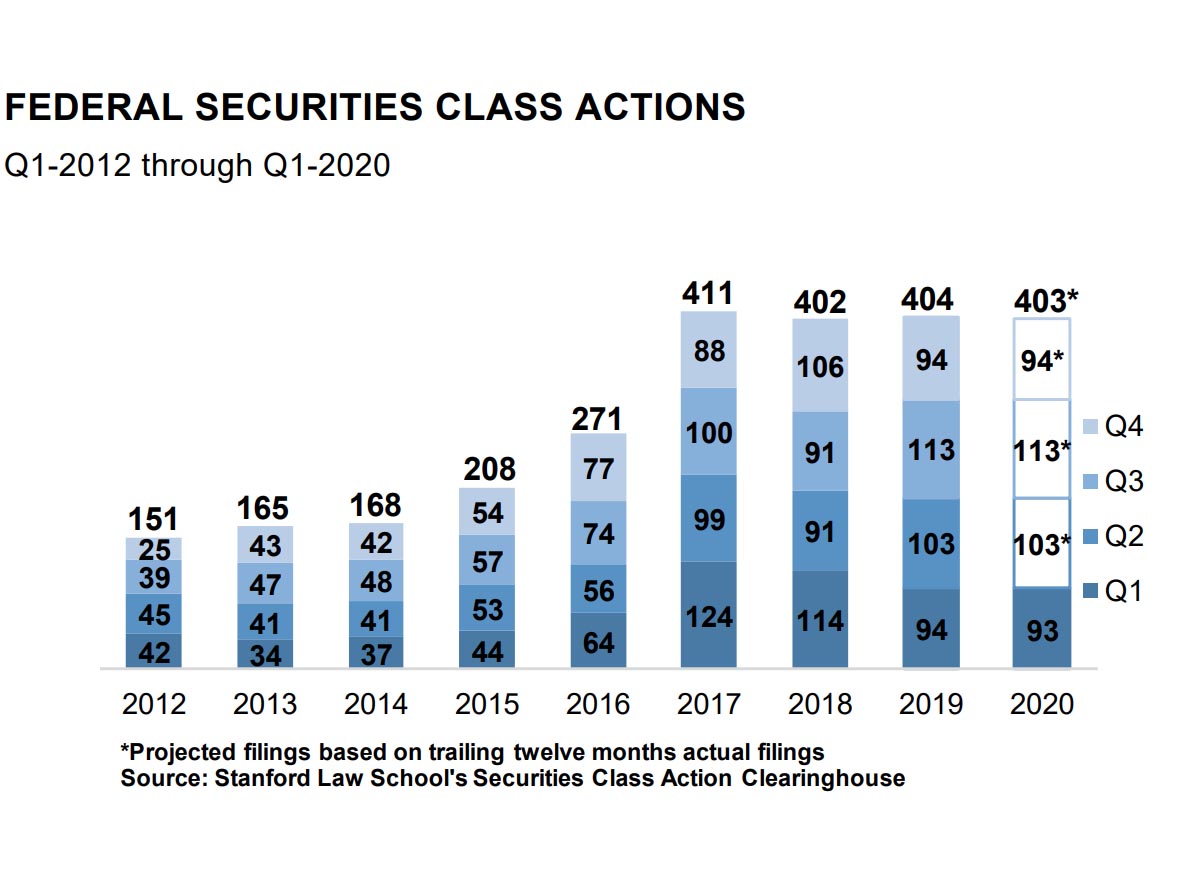
© Aon plc 2020. All rights reserved. Image courtesy of the Aon Quarterly D&O Pricing Index.
Considering the litigation that is sure to come from COVID-19 related claims, D&O market experts are preparing for the aftermath. While breadth of coverage is likely to stay the same, D&O claims are increasingly event-driven, and insureds are bracing for a difficult road ahead. &