Sponsored: Ventiv Technology
7 Ways to Leverage Artificial Intelligence Now to Impact Risk Management and Avoid Drowning In Data

More than 90 percent of the world’s data has been generated in just the past two years. And the accumulation of new data will only continue to accelerate as new sources emerge every day. In 2016, the Internet of Things was connecting 5.5 million new devices per day, and according to Gartner, the total number of IoT devices will hit 20.8 billion by 2020. That will equate to roughly 2.5 devices per person on the planet.
For risk managers, IoT-generated information will only add to company-specific data like headcount, revenue, property values, number of vehicles, claim frequency, claim severity, and geography. Not to mention third-party sources such as weather, census, and industry data.
Many of the potential insights to be gleaned from this data, however, remain out of reach for risk managers who simply don’t know where to jump in or how to begin processing it.
“The sheer volume of data to churn through is overwhelming. Where do you start your exploration journey?” asked Kristi McFarlin, Vice President, Analytics, Ventiv Technology. “Finding a starting point is one of the biggest data analysis challenges for risk managers.”
Risk management departments are already under pressure to contend with rapidly-evolving exposures and often face an uphill climb presenting data to senior leadership in order to get buy-in for new programs. Finding ways to tackle enormous volumes of data, however, has big benefits. Data-driven risk management programs provide risk managers with critical business insights such as notification to move people and assets out of harm’s way, reducing claim frequency and severity.
Artificial intelligence can make massive troves of data accessible to everyone on the risk management team, helping them not only achieve better outcomes with fewer resources, but also make stronger recommendations to the C-suite—recommendations that are supported by data-based findings.
“Advanced analytics tools powered by AI democratize data. This provides users access to the data across the organization and empowers them to use this data for improved decision-making,” McFarlin said.
Here are seven reasons why risk managers should implement artificial intelligence at their organizations sooner rather than later:
1. AI identifies a starting point for data exploration.

Kristi McFarlin, MBA, ARM, Vice President, Analytics, Ventiv Technology
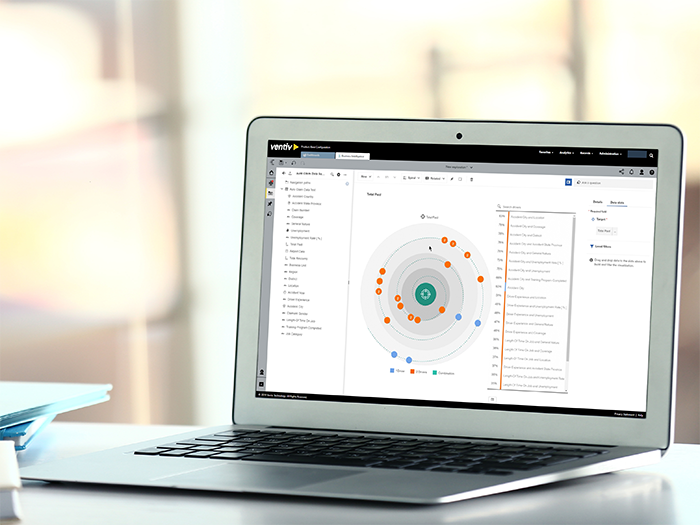
An AI platform will churn through all the available data and recommend starting places to begin your data exploration journey.
“The AI platform will reveal relationships and showcase connections between different data points. You may not necessarily be able to visualize these correlations on your own. This process also surfaces all potential loss drivers,” McFarlin said.
Once the starting point is identified, risk managers can perform key-driver analysis, which looks more closely at a particular relationship to find additional insights related to the variables that are driving that outcome.
2. Automation removes confirmation bias.
Historical-data analysis generally involves asking a specific question and receiving a response that either confirms or disproves a hypothesis, naturally introducing confirmation bias into the equation.
“That’s a very common pitfall of data analysis. It can cloud your results and also block the potential for discovering new insights,” McFarlin said. If the risk manager’s suspicion is confirmed, he or she may take that information at face value without probing any further. However, when the responses returned are in the form of patterns and connections – rather than a definitive yes or no – it naturally fosters follow-up inquiries.
“AI-driven analytics is an iterative process,” McFarlin said. “AI finds connections in the data relevant to your target, rather than ‘answering’ specific questions. In this way it removes bias inherent in the way a question is phrased, prompts further research, and can drive additional insights.”
3. Conversational, natural-language queries make data analysis accessible to anyone.
Another way AI enables the iterative process is through queries that are made using conversational, natural language. Just like you type a question into Google or confer with Siri, the user can ask plain-language questions, which the AI assistant translates into input fields. There is no need to possess any technical skills.
“The ability to make queries using conversational language bridges the skills diversity within an organization. Not everyone knows code, and not everyone has to,” McFarlin said. “You’re able to just ask a question, and the AI assistant will generate automated visualizations of the data.”
According to McFarlin, generally speaking, 60 percent of people at an organization are data consumers, 30 percent are data explorers, 8 percent are data analysts and only 2 percent are bona fide data scientists.
“These tools make the 98 percent as capable as the 2 percent,” McFarlin said.
4. Automated visualization puts data connections into a more tangible context.
Just like the AI assistant turns plain-speak into digital language, it also returns information that is easily digestible by creating visual displays of data connections.
If, for example, the user wanted to know the breakdown of their total claims paid, the AI assistant may identify connections with geographic locations or jurisdictions and return a “heat map” showing claims hotspots throughout a designated region. It can also overlay third-party data onto that map, such as national averages or industry benchmarking. Alternatively, it might produce a word cloud or scatter diagram to show associations between various claim drivers.
“The AI assistant will decide how best to show the relationships based on the data pulled into the question,” McFarlin said.
5. Pattern detection highlights previously undetected claim drivers.
The power of AI may show itself most prominently in its ability to find patterns among disparate sets of data that would ordinarily go unnoticed.
By running data through a decision tree, an AI platform can segment and stratify data by common characteristics. Segmentation may be another way to identify factors driving your target — whether that’s claims frequency or severity — and offer some predictive value.
“If the target metric is total paid workers’ comp claims, for example, the platform will start identifying different subsets of data such as the state of jurisdiction, the employee’s length of time on the job, or body part injured. Further analysis is generated for each segment group that will allow for an automated stratification by claim value,” McFarlin said.
“In other words, it will group together characteristics of claims valued in different stratifications and help you predict the potential severity of the next claim that has these characteristics.”
6. AI helps build data into a narrative that leadership can understand.
The ultimate purpose of identifying drivers of frequency or severity is to reduce them, which often requires an investment in targeted risk management initiatives. To get that investment, risk managers need to be able to tell a story. Presenting senior executives or the board of directors with endless stats and charts is not as effective as laying out a narrative.
Advanced analytics can help with that too.
“You have all this data and do this exploration to find key insights, but do you effectively communicate those results? It’s pinning down the things you want to act on and putting that into a story, creating a narrative that the rest of your organization can identify with,” McFarlin said.
An advanced analytics platform can curate insights into an animated storyboard, walking viewers through the data and its meaning for a company’s claims experience.
7. Scalable systems can adapt to the exponential growth of data.
The volume of data is projected to grow by a factor of 10 in the next two years. Having a structure able to grow with it will be critical to the success of a data analytics program.
“Scalability is important. As the pool of data an organization accesses grows exponentially, your system should be able to ingest all of it and continue functioning at a high level,” McFarlin said.
AI and machine learning platforms are designed to adapt as new streams of information flow through them.
Data and analytics have always been integral to insurance and risk management but have traditionally been left in the hands of dedicated specialists. Applying artificial intelligence is what risk managers need to generate insights faster and in a format that is easier to operationalize.
Ventiv’s advanced analytics platforms are designed to put data analysis in the hands of the risk manager. Its streamlined platforms combine data analysis and reporting functions in one, making it easier to deliver information to company leaders in less time and with fewer resources.
To learn more about Ventiv’s products and how they can help organizations implement AI, visit https://www.ventivtech.com/what-we-do/analytics.
This article was produced by the R&I Brand Studio, a unit of the advertising department of Risk & Insurance, in collaboration with Ventiv Technology. The editorial staff of Risk & Insurance had no role in its preparation.


