Flood Modeling
Comparing Flood Maps
A greater validation of inland flooding data is required to improve the accuracy of U.S. flood models.
That was one of the key conclusions from presenters at the first comparison of U.S. inland flood risk modeling of its kind hosted by Ariel Re at Lloyd’s of London in November. The event, led by Dr. Federico Waisman, senior vice president, head of analytics, Ariel Re, showcased the U.S. flood models of four leading vendors: AIR, CoreLogic, KatRisk and Impact Forecasting.
RMS pulled out of the presentation because their model was not ready on time.
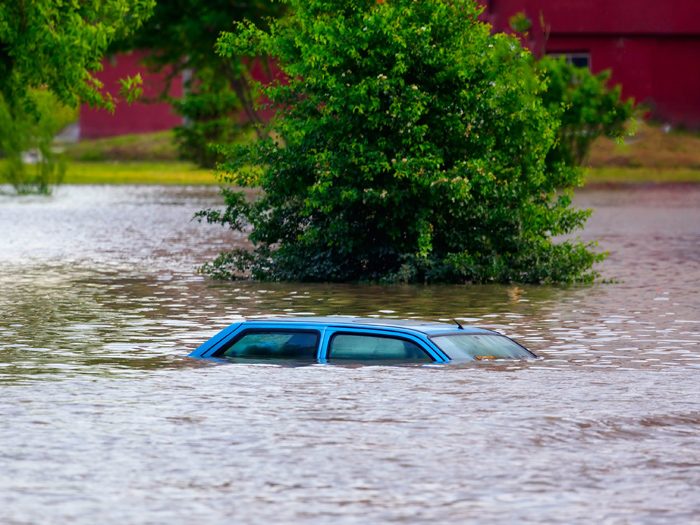
Compared to their earthquake and hurricane counterparts, flood models for U.S. risks are still in their relative infancy, relying largely on limited National Flood Insurance Program (NFIP) data. But in the wake of the devastation of thousands of homes and businesses caused by the effects of Hurricanes Harvey, Irma and Maria, the need for better flood modeling has arguably never been greater.
“Having more validation data would always be helpful,” said KatRisk’s chief technology officer and co-founder, Stefan Eppert.
“While in the U.S. we have got very good hazard data and excellent organization of data, on the loss side it would be nice to have generally agreed standards.”
Cagdas Kafali, senior vice president, research and modeling, AIR Worldwide, said there also needs to be more focus on commercial data sets.

Federico Waisman, senior vice president, head of analytics, Ariel Re
“There is some residential data available, but it’s also going to be important to validate these models’ vulnerability when it comes to the commercial risks,” he said. “The problem is that there is a lot of engineering assumptions in the absence of actual claims data.
“It’s also very difficult to get to peril-specific and coverage-specific claims when it comes to multi-location policies with sublimits. Hopefully that data will be available in the future and that will help to enhance the models.”
Risk Variety
Aon Benfield Impact Forecasting’s head of research and development, Siamak Daneshvaran, said that a bigger problem is capturing the different types of flooding risk.
“Flood risk is spread all over the country,” he said.
“It’s not only in river bank areas; you can have flood in pluvial regions that might be outside of the flood plain maps that FEMA [Federal Emergency Management Agency] is producing.
“Therefore, the models need to laser in and generate more events to define the correct flood plain maps. Also, to capture events like Hurricane Harvey, where there was a large loss in downtown Houston, we really need to understand pluvial processes, drainage and all of those issues.”
In terms of available claims data, all four models draw on NFIP data to varying degrees, the panel surmised.
CoreLogic and KatRisk both use a combination of NFIP and company claims data, while Impact Forecasting supplements that with Aon’s own data to calibrate its model.
AIR’s Kafali, however, warned that when using NFIP data, its own limits shouldn’t be used as replacement values.
“Instead, in our model, we used actual replacement values from industry exposure data,” he said. “That gave us the actual cash value policies for contents so we could model them as an exposure.
“We have also been able to push the limits by looking at the data which has come from weather factors like storm surge. That has enabled us to make a lot of assumptions on the residential side, however, the commercial data is somewhat lacking.”
Flood models
Compared on a similar basis spread across 1.2m locations nationwide, AIR’s Inland Flood Model for the U.S. registered the highest number of flooding events per year, while CoreLogic’s U.S. Inland Flood Model: RQE v17.0 posted the lowest.
AIR also pegged the largest average annual gross loss by region at $576.4 million — 3.1 times larger than the smallest, KatRisk’s SpatialKat U.S. Inland Flood Model, at $185.1 million.
In three out of four vendors (AIR, CoreLogic and KatRisk), California accounted for the biggest loss, followed by the Ohio and Texas-Gulf regions.
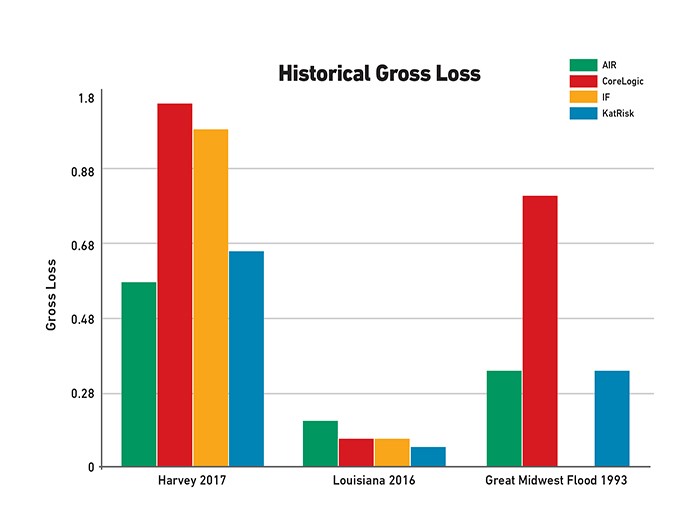
Then the models were compared based on three historical scenarios: Hurricane Harvey (a precipitation event), the 2016 Louisiana flood (hurricane) and the 1993 Great Midwest flood (riverine).
“The challenge for users of these models is to interpret and make a decision about the various sciences and assumptions made to form your own view of the risk. That challenge is much greater than in other models like earthquake and hurricane where many models have been developed over the years.” — Federico Waisman, senior vice president, head of analytics, Ariel Re
CoreLogic reported the highest gross loss for Harvey at $986.4 million, closely followed by Impact Forecasting’s U.S. Inland Flood Model v11 at $915.2 million.
KatRisk and AIR were at the lower end with $591.4 million and $497.1 million respectively.
The same is true of the average claim size, with CoreLogic coming in highest at $86,431, Impact Forecasting with $44,398, KatRisk $22,467 and AIR $11,338.
That correlated with the number of claims, with AIR reporting 43,845 claims, KatRisk 26,321, Impact Forecasting 20,613 and CoreLogic 11,413.
It was a similar story for the Great Midwest flood, with CoreLogic coming in highest for losses at $741.6 million and average claim size of $55,823, while it also identified the lowest number of claims at 13,284.
However, with the Louisiana flood, the one outlier was AIR, which estimated the largest loss at $124.3 million but the smallest average claim at $4,704. It also captured the largest number of claims at 26,434.
“AIR has the lowest average claim size across all three of the historic scenarios and CoreLogic the highest,” said Waisman.
“AIR also has the largest number of claims and CoreLogic the lowest.”

Kafali said that the difference in event frequency between the models could be down to the definition of an event.
“Event definition may be one reason why we have different numbers, because we might be defining events differently,” he said.
“It’s not like with earthquake and hurricane where you have a defined scale of measurement.”
Eppert added, “By rights, the event definition should be driven by contract terms. However, this has the downside that you have got a different event set for each contract, so there’s a compromise between adequately representing the terms that you insure and being able to communicate the losses.”
Biggest Challenges
Waisman concluded that while there were many similarities between the models’ results, there were also a lot of material deviations.
“In fact, the norm tends to be more deviations than similarities,” he said.
“The differences tend to be higher when we extend the model to its limits, like higher return periods, or under extreme circumstances, like high deductibles, where they depart the most.”
He added: “The challenge for users of these models is to interpret and make a decision about the various sciences and assumptions made to form your own view of the risk. That challenge is much greater than in other models, like earthquake and hurricane, where many models have been developed over the years.
“Flood as a peril, by contrast, is extremely complex to model. The U.S. has a variety of precipitous weather patterns and not enough claims data, but I have no doubt that all four of these vendor models will help play a part in tackling this problem.”
Head of Lloyd’s risk aggregation David Clouston concluded, “Widespread flooding as a result of windstorms Harvey and Irma has once again highlighted the costs of natural catastrophes — both in terms of human suffering and economic hardship. The need for a deeper understanding of inland flood modeling is therefore more important than ever.” &